- Начало
- Софтуерна интеграция
- Мониторинг на сървърни системи
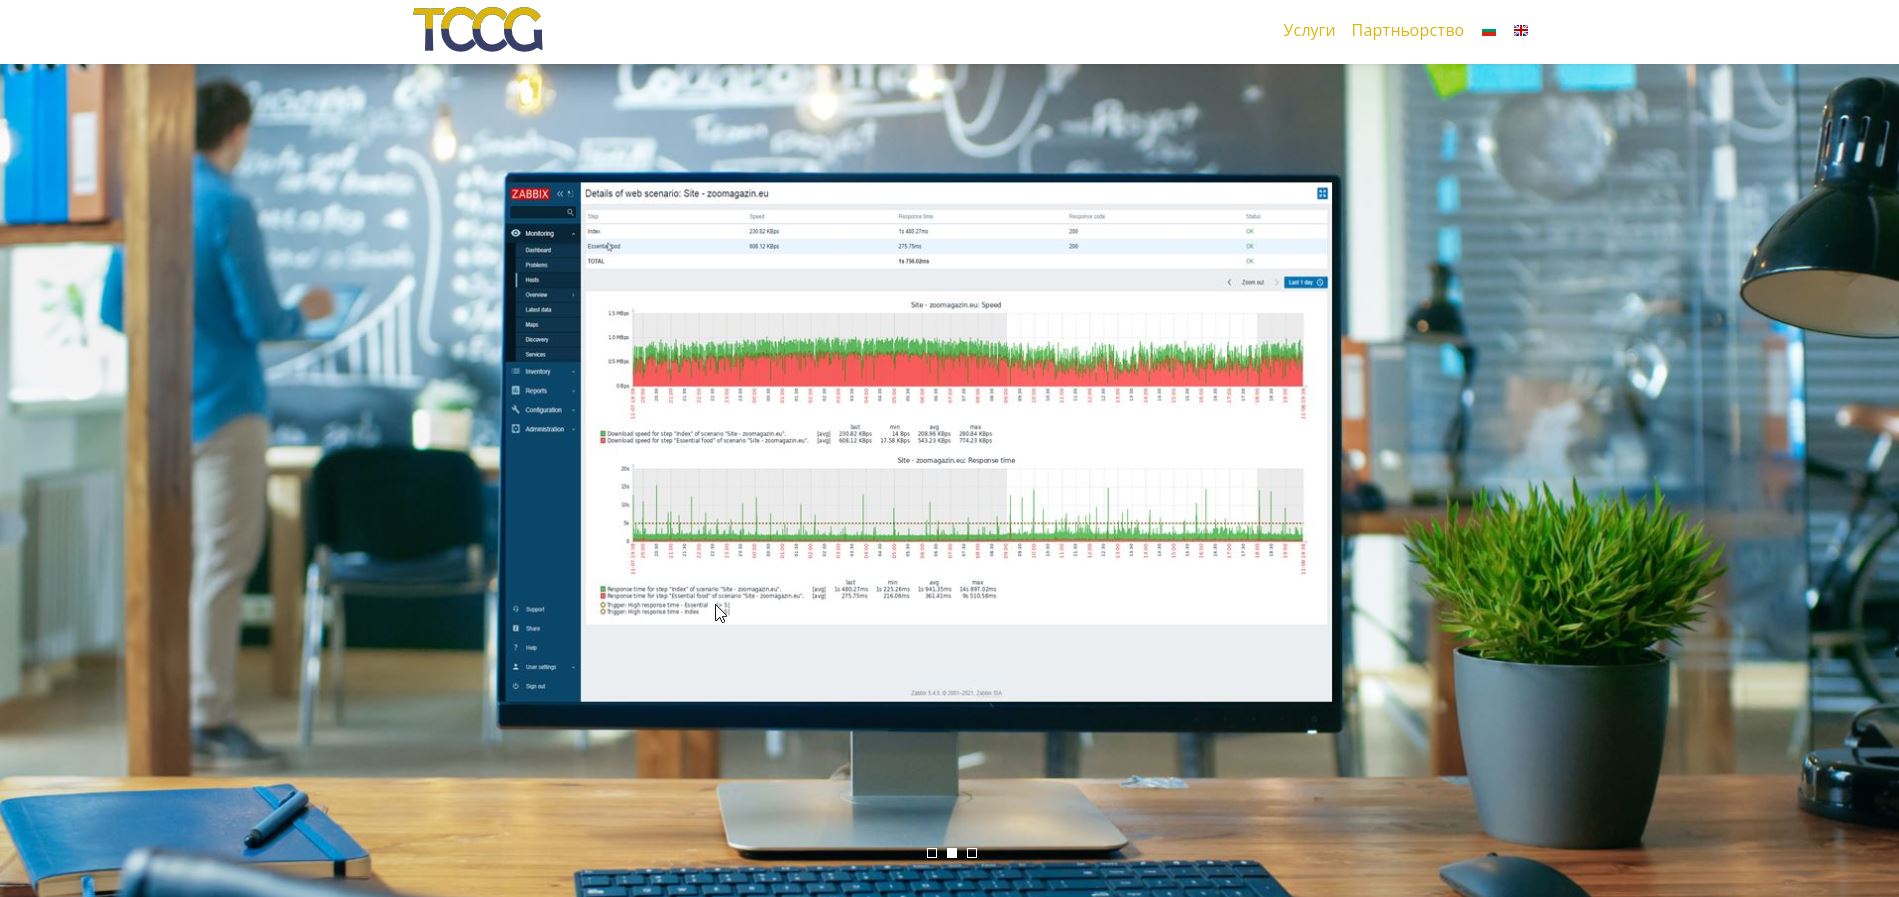
МОНИТОРИНГ НА СЪРВЪРНИ СИСТЕМИ
Услугата е предоставена от нашият партньор Ти Си Консултинг Груп
Услуги:
 СИСТЕМНА АДМИНИСТРАЦИЯ СИСТЕМНА АДМИНИСТРАЦИЯ
|
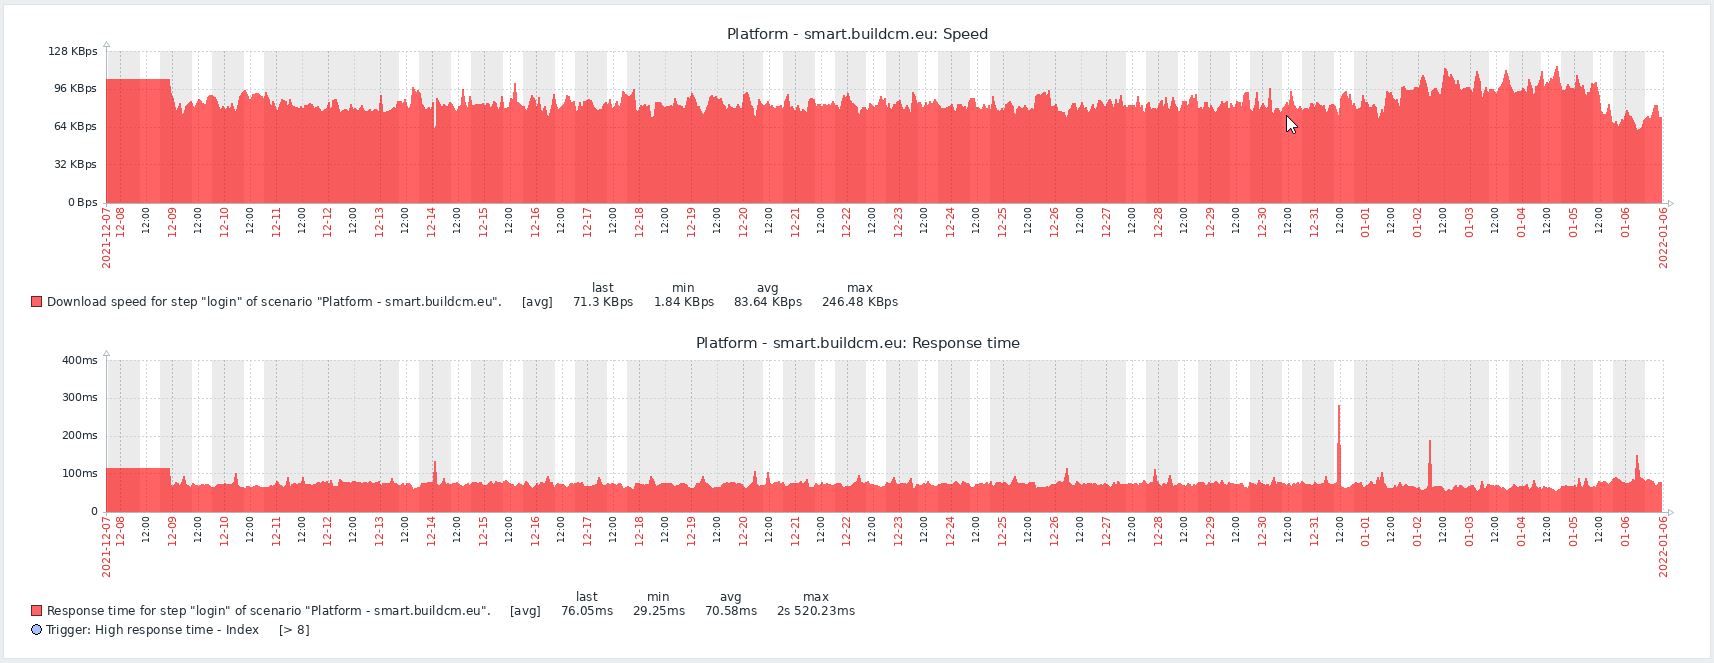
 СЛЕДЕНЕ НА СЛЕДНИТЕ ПАРАМЕТРИ: СЛЕДЕНЕ НА СЛЕДНИТЕ ПАРАМЕТРИ:
|
 АВТОМАТИЧНИ ТРИГЕРИ И ИЗГОТВЯНЕ НА SLA РЕПОРТИ ЗА:
 24 часов мониторинг с реакция в работно време.
МОНИТОРИНГ НА СЪРВЪРНИ СИСТЕМИ
Услугата е предоставена от нашият партньор Ти Си Консултинг Груп
Услуги:
СИСТЕМНА АДМИНИСТРАЦИЯ
|
СЛЕДЕНЕ НА СЛЕДНИТЕ ПАРАМЕТРИ:
|